
“Reversion to the mean” is a mathematical principle that all investors should be familiar with, yet few likely are, says one of North America’s leading private wealth advisors. After all, markets reveal on a daily basis how few investors grasp this concept as “the herd” chases returns of surging assets—buying high—only to bail out at a later date at lower prices when these investments inevitably fall in value, says Thane Stenner, founder of Stenner Wealth Partners+ at CG Wealth Management and Chairman Emeritus of ultra-high-net worth network Tiger 21 in Canada.
“I have been in the business for over 25 years, and if there’s one trait that reduces returns and kills wealth, it’s investors chasing hot investments with strong recent trailing 1-3 year performance,” says Stenner, who previously held award-winning consulting roles at Morgan Stanley/Graystone Consulting as Managing Director, International Client Advisor, Institutional Consulting Director, Alternative Investments Director and Portfolio Manager. Stenner is cross border-licensed with FINRA in the United States and CIRO in Canada and his Consulting team steers the investment portfolios of some of Canada’s wealthiest families. CG Wealth Management currently advises on C$115 billion in client assets globally.
He hosts the Smart WealthTM with Thane Stenner podcast, produced by BNN Bloomberg Brand Studio. Thane’s virtual/in-person Multi-Family Office/Outsourced CIO Consulting team deals with 51 clients across Canada including many Single-Family Offices (SFOs) (previously #1 Ranked California based consulting team on the Barron’s Top Institutional Consultants 2020 List, and now based back in Canada for the last four years). Thane and his US and Canadian teams have guided/transacted on billions of dollars’ worth of securities over his career.
Stenner sat down with Canadian Family Offices to share his insights on mean reversion and where he sees it making the biggest impact.
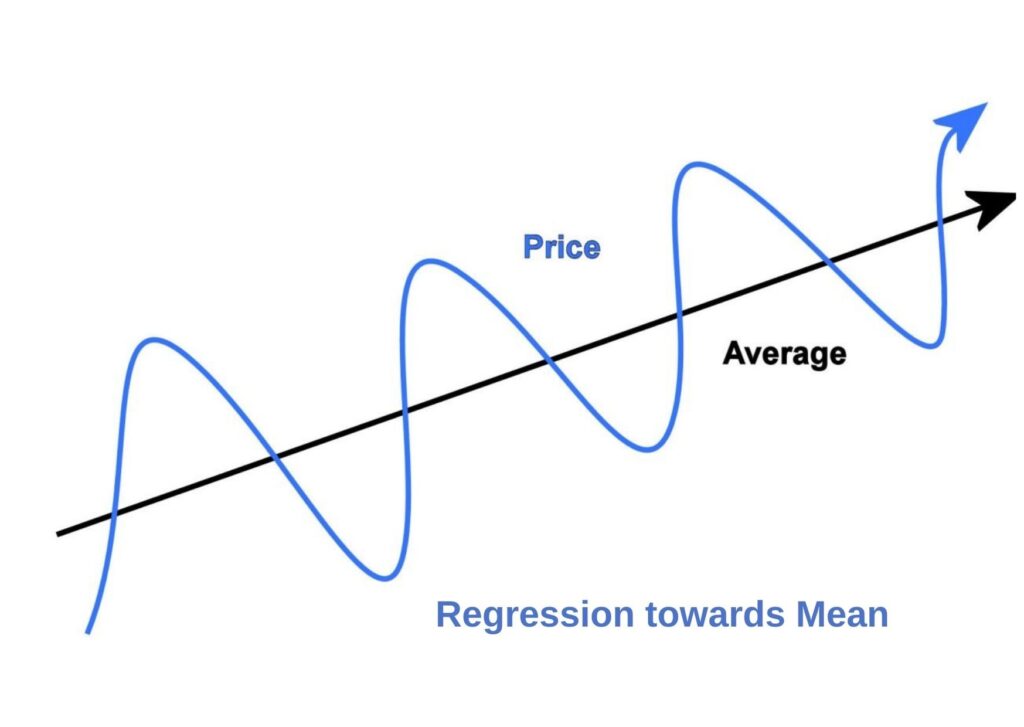
An expert in asset allocation and due diligence, Stenner says investors who understand mean reversion recognize better than others—to borrow a saying from the Great One, Wayne Gretzky—“where the puck is headed” opposed to where “the puck” has been today. Consequently, they are more likely to trim profits from top-performing holdings before they fall in value and invest more in underperforming assets/managers/strategies poised to rebound/move up sooner.
Understanding mean reversion lets you understand where you are in the market cycle, providing that 36,000-foot, big-picture view.
In short, it facilitates your ability to recognize potentially profitable patterns, while also reducing risk in capital deployment. That said, doing so requires know-how to sift through the market noise. In the charts below, Stenner provides a primer on how to do just that, showing how mean reversion impacts market cycles, creating risks to avoid and opportunities to seize upon to drive long-term investment outperformance.
Beware of aging bulls
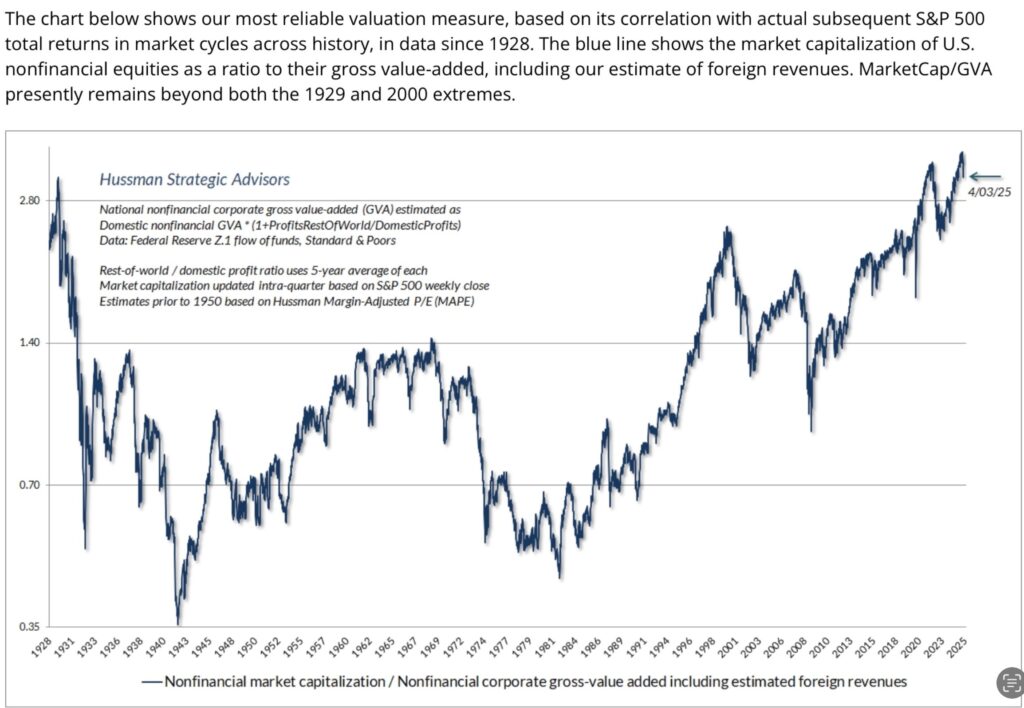
If you truly want to understand just how overvalued the United States’ stock market has been very recently, even amid U.S. President Donald Trump’s trade tirades, this chart from early April speaks volumes, Stenner says.
“It is essentially screaming to someone who understands mean reversion that you should not be allocating a lot of capital to the U.S. stock market right now, aside from a possible bear market tactical rally in the short term” Stenner says. Even in early April, after a market correction that started on February 19, 2025 (see link to a recent interview with Mr. Stenner on Canadian Family Offices last February 19th, 2025 warning investors about the U.S. markets then), the S&P 500 still had valuations as high as when the U.S. market peaked in 1929 before it crashed, sparking the Great Depression. “The big picture here reveals a pattern where the current valuations in the U.S. remain remarkably similar to the late 1920s prior to the stock market losing about 80 per cent of its value,” Stenner explains. Additionally, the chart’s “jagged saw” reveals how the market back then experienced several significant/powerful bear market rallies before reaching its ultimate bear market bottom in 1932. Of course, this chart also demonstrates that mean reversion works the other way, illustrating that when markets become very cheap, they eventually pivot into a long bull market— “like in 1943 when the market took off as it became clearer that the Allies were winning the Second World War.”
Here is a colour-coded illustration of how mean reversion can guide asset allocation:
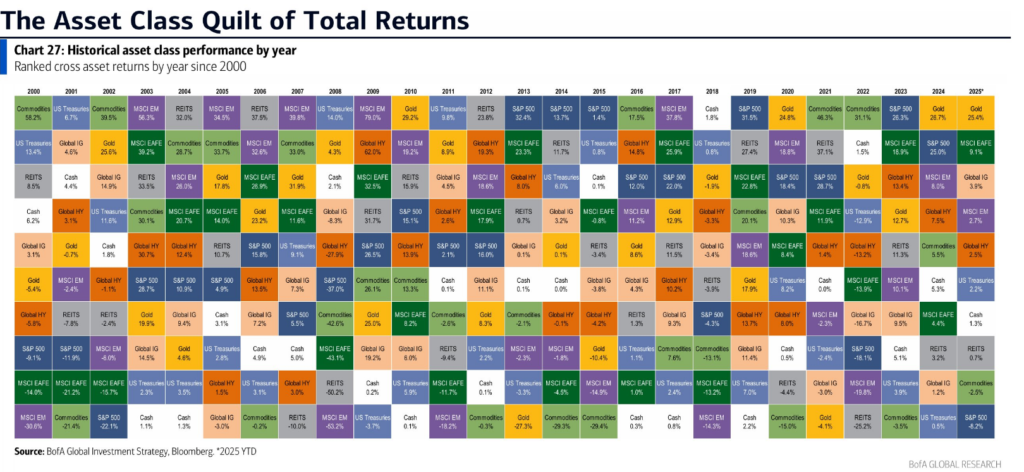
The above chart—showing the annual performance of various asset classes, strategies, sectors and geographical markets—highlights how an understanding of mean reversion can guide portfolio construction and rebalancing to reap the full benefits of diversification. “This really shows the rotational performance patterns for asset classes, and how what goes up strongly tends to come back down and vice versa,” Stenner says.
Commodities are particularly illustrative, given their cyclical nature of strong performance over 1-3 years, for example, followed by underperformance the following 1-3 years.

“When someone looks at this chart, they see five years of commodities basically going sideways/flat, and might conclude, ‘Commodities are dead money,’” Stenner says. He adds this would be an assumption that does not account for mean reversion, leading an investor to miss out on commodities outperforming years, like 2021 and 2022 when the combined performance exceeded 70 per cent.
What’s more, investors who had assumed commodities were “dead money” would likely have changed their tune after seeing the asset class significantly outperform, increasing the likelihood of buying high and the risk of selling low amid underwhelming cooling performance.
Be like Buffett
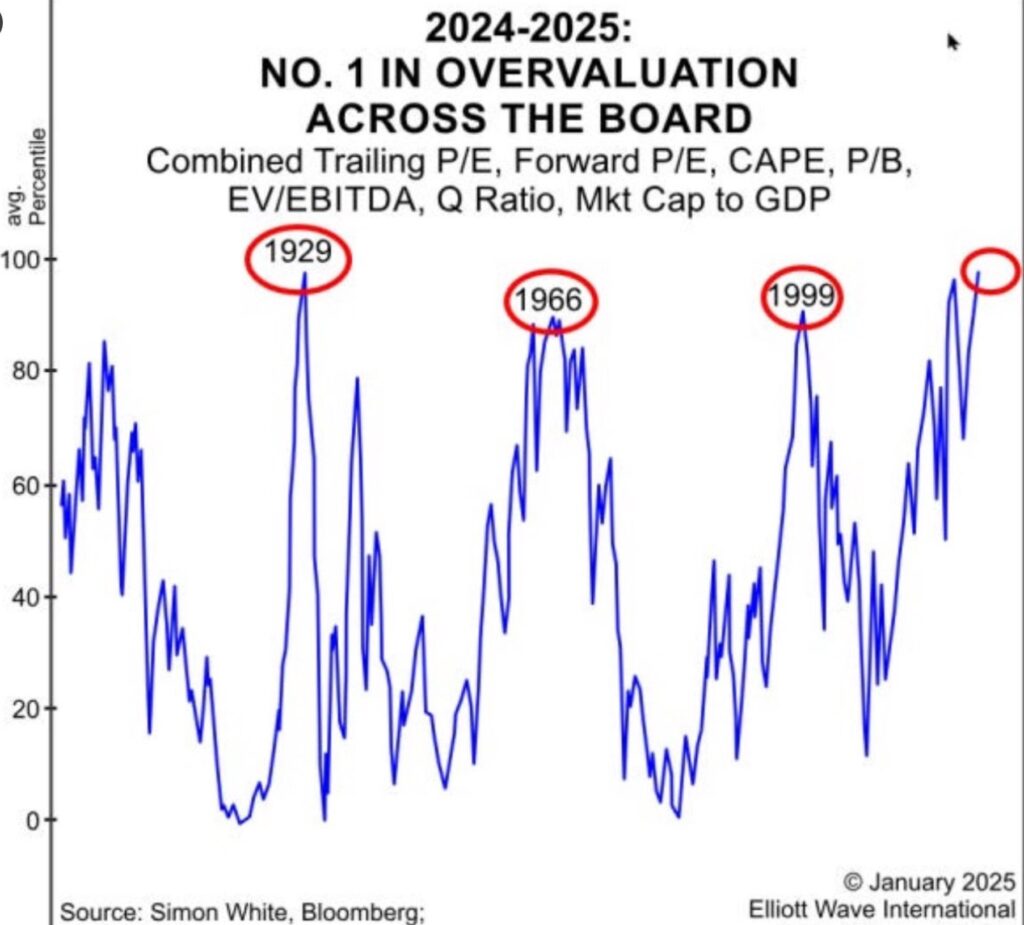
Combining several valuation metrics, this chart in January 2025 provides a comprehensive view of the current market’s overvaluation relative to other stock market peaks over the past several decades/century. Among the ratios used is market capitalization to GDP (gross domestic product). Widely called the “Buffett Indicator,” after Warren Buffett, chairperson of Berkshire Hathaway, it allows investors to determine whether an investment is overvalued or undervalued. Valuation metrics are not short-term indicators but can still be very helpful where “to be leaning”/looking forward. To that point, Buffett likely sees the market similarly to this chart—that it is highly overvalued, given Berkshire Hathaway, an institutional equity investor, currently has US$334 billion in cash on the sidelines based upon most recent reports.
“It might be popular to have cash amid upheaval, but in January/February 2025 at the peak of the U.S. market, it wasn’t,” Stenner says. Indeed, investors like Buffett understand mean reversion, and that helps them remain committed to their investment thesis even when markets continue to move in the opposite direction. “But what eventually ends up happening is markets peak and come down, with Buffett buying good companies on sale,” he says. “It’s why he’s arguably one of the best investors of all time.”
How mean reversion makes the case for investing longer term in commodities today
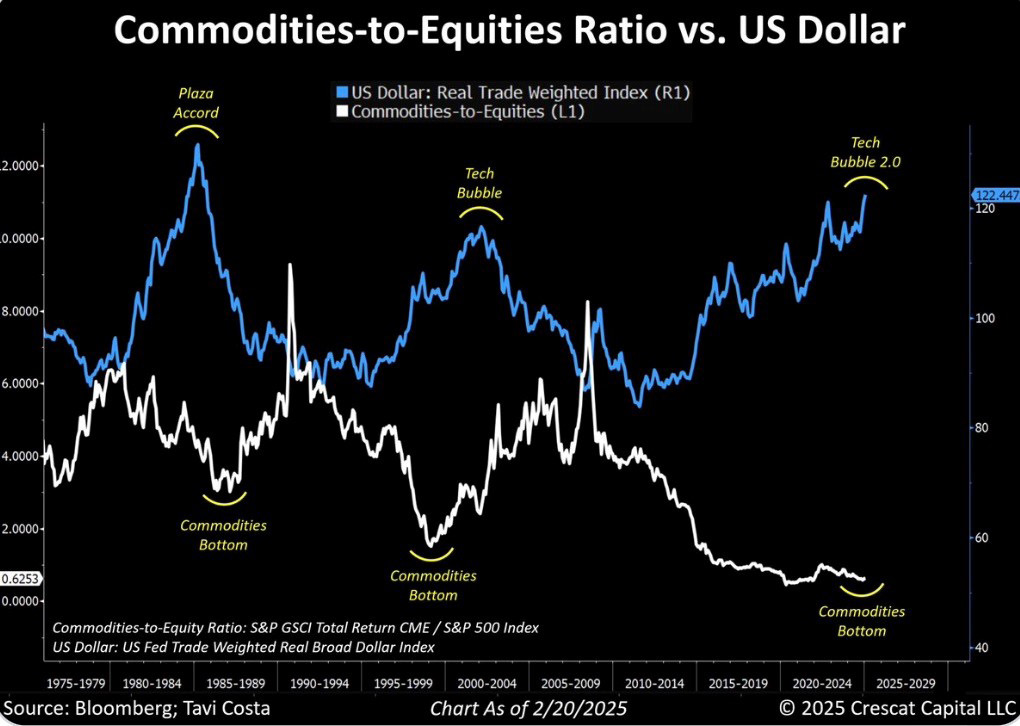
If understanding mean reversion helps investors recognize overvaluation and risk in the broad U.S. market, it also can reveal opportunities. That includes commodities, which “reached their ultimate peak in 2012,” Stenner notes. “They have had some runs since, but valuations are still low by historical averages.” He points to the above chart, showing prolonged recent underperformance based on 50 years of data. “Does this mean commodities will take off soon? Not necessarily, but you can infer we’re nearer to the bottom, and very far from the peak and even commodities’ historical mean,” Stenner says. As such, the chart suggests that commodities-related strategies are an investment with a high likelihood to outperform substantially at some point in the coming years, he argues.
Gold glitters, but gold miners may soon outshine
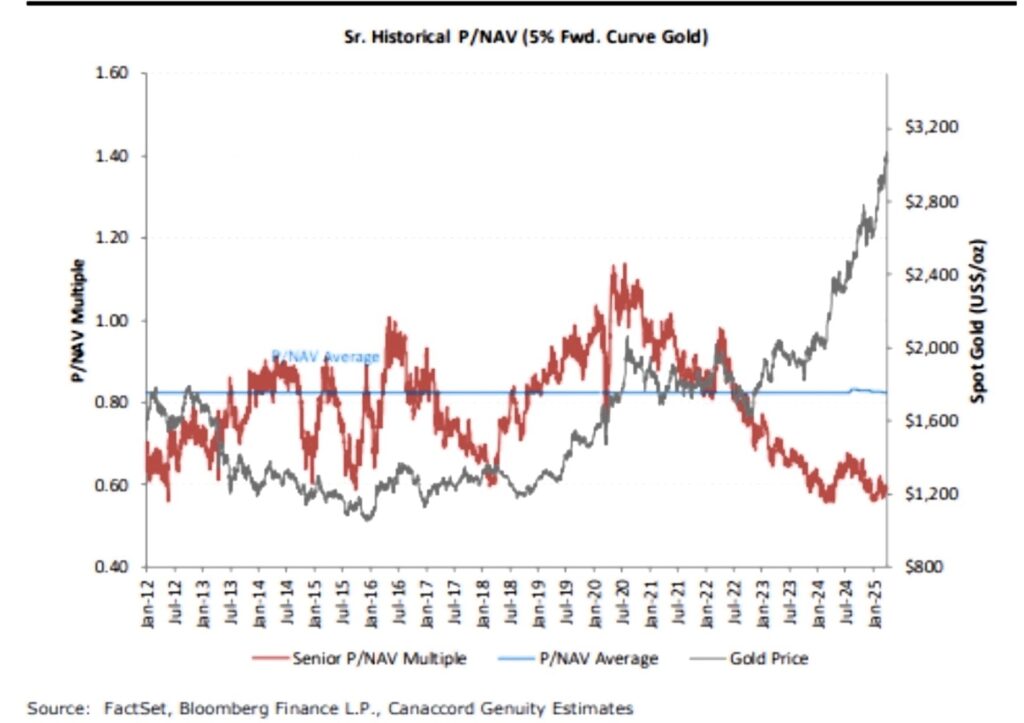
This chart shows how gold stood out among commodities, having reached new historical heights by just recently reaching an all-time high price of 3,500/oz (USD), Stenner notes. Yet the chart reveals another insight. “It shows how gold miners have significantly underperformed vis-à-vis the commodity.” Particularly noteworthy is the yawning spread between gold’s price and gold miner valuations—which Stenner refers to as “alligator Valuation jaws” stretched wide pointing toward an intriguing opportunity. “What I know for sure, based on this chart, is most investors don’t own a lot of gold mining companies/ETFs or commodities-related strategies.” Yet given gold’s run, eventually the market will turn its attention to these resource firms, especially as profits grow driven by the higher price of gold. Already, as of April 2025, miners’ collective profitability is at a two-year high, Stenner adds.
“It’s just that investors have not paid much attention yet, so when I look at this chart, mean reversion comes to mind.” When assessing where to invest capital, an understanding of the chart suggests that the investment opportunity is not the underlying commodity itself, which is probably at risk to fall in price in the short term from its current heights. “Rather, it’s the miners that are poised for a run over the next 2 to 3 years based on the historical patterns,” he says.
Where mania meets the mean
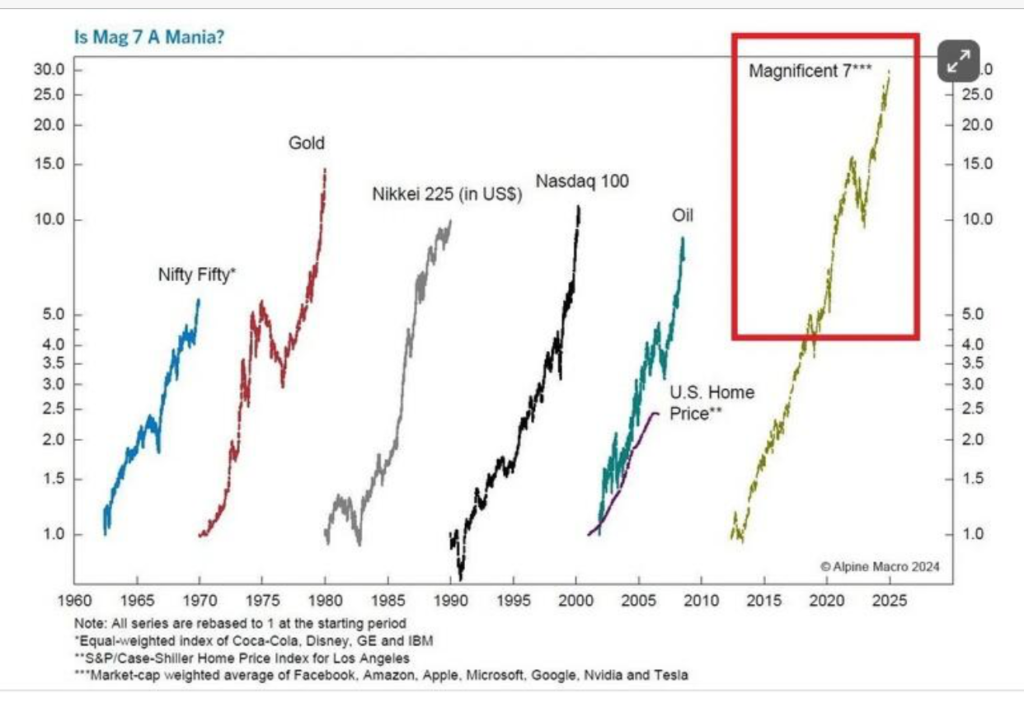
With an understanding of mean reversion, investors can uncover opportunity and also potentially avoid disastrous strategies/assets/sectors. Yet the above chart clearly illustrates the opportunity of buying early in a trend before it takes off and avoiding investing at major peaks. Notably, it shows the so-called “Magnificent Seven” stocks—Nvidia Corporation, Meta Platforms Inc., Apple Inc., Alphabet Inc., Microsoft Corp., Amazon Inc. and Tesla Inc.—and their collective rise in value over the last decade to their peak valuation at the start of 2025, essentially mirroring past investment trends that led to investor mania before ending with steep declines in value. Their rapid ascent, for example, is similar to the bull market for the NASDAQ 100 in the 1990s that eventually led to the dot-com crash in the early 2000s, and a peak to low bear market decline of over 80 per cent plus.
Yet five years prior to the dot-com bubble becoming a bear market for technology, the sector as a whole averaged 25 per cent compounded rates of annualized return, Stenner says. That led many investors to chase returns on the way up, and then sell at a loss on the way down as the NASDAQ 100 fell 89 per cent from its peak upon reaching its bottom in 2003. A very painful mean reversion pattern.
He further notes by then the NASDAQ 100 “became a buy again.” Similarly, gold surged with “lineups to buy it at its peak price in 1978 and 1979, but where were those lineups in 1970 when gold was really cheap?” Broadly, the chart reveals how investor mania plays out over and over because most investors collectively fail to understand and take advantage of mean reversion patterns.
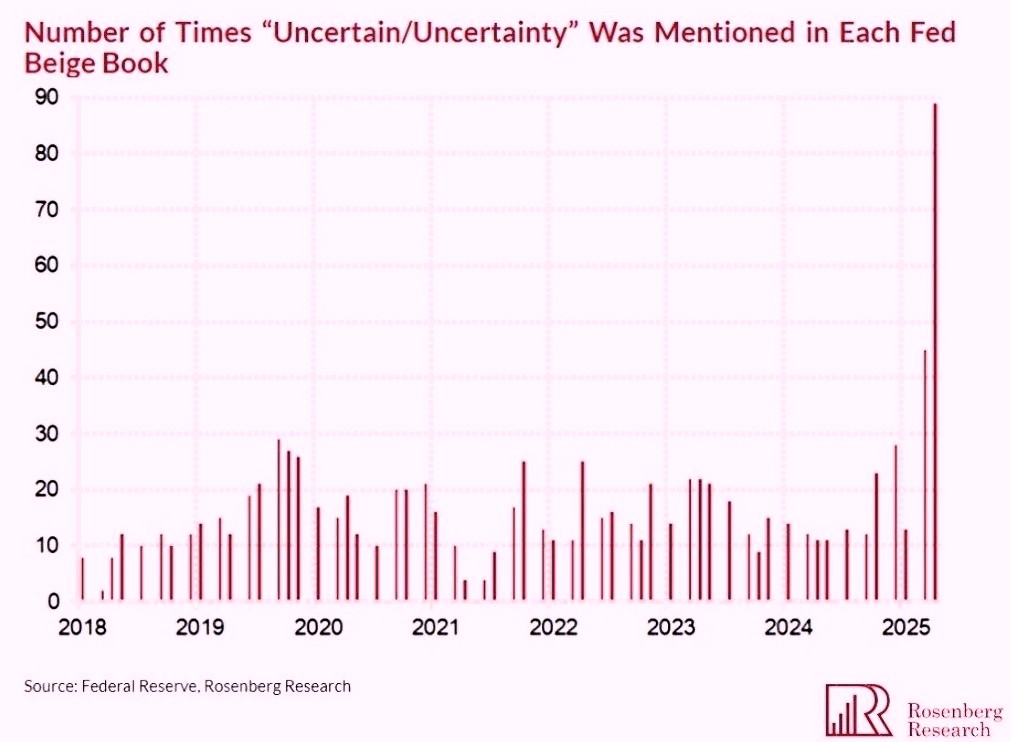
“Maximum uncertainty tends to create strong buying opportunities either for tactical shorter-term moves, like we are seeing now, and potentially for decent longer term up moves as well. This one points to and confirms the current sharp bear rally we are experiencing this last week.” (as of April 25th/25 at the time of this writing)
“These patterns repeat themselves, soaring and then bottoming out, and over the long term these establish a trend line of fair market value, which is the mean.” Ultimately, an OCIO Consulting firm or family office’s understanding of how valuations eventually revert to the mean helps make better, risk-adjusted decisions, Stenner says. “And that’s a fundamental trait to becoming a successful investor over the long-term. This contrarian trait is what the best investors in the world have mastered.
*Responses have been lightly edited for clarity and length.
Follow Thane Stenner and Stenner Wealth Partners+ on LinkedIn.
About Stenner Wealth Partners+
Stenner Wealth Partners+ (SWP+) is an in person/virtual Multi-Family Office/Outsourced CIO Consulting team of financial/wealth specialists with a boutique approach and global perspective. SWP+ serves Canadian and US investors/households with generally a minimum of 10M+ in investable assets or 25M+ net worth. As a CG Wealth Management team, SWP+ is a highly exclusive practice team with one of Canada’s largest independent wealth management firms. Client Range of Net Worths: between $25M To $2.5B+. New Client Engagements: Strategically on-boards only 6-8 new key relationships annually.
About CG Wealth Management
The global wealth management business is entrusted with C$115 billion in client assets.1 The wealth management operations of the Canaccord Genuity Group (CG Wealth Management) provide comprehensive wealth management solutions and brokerage services to individual investors, private clients, family offices, Donor Advised Funds (DAFs), and intermediaries through a full suite of services tailored to the needs of each client.
1Canaccord Genuity Annual Report, December 31, 2024
Disclaimer: This story was created by Canadian Family Offices’ commercial content division on behalf of Stenner Wealth Partners+ at CG Wealth Management, which is a member and content provider of this publication. CG Wealth Management is a division of Canaccord Genuity Corp., member of CIPF and CIRO. Thane Stenner’s views, including any recommendations, expressed in this article are his own only, and are not necessarily those of Canaccord Genuity Corp.