Markets don’t move on what happens alone—they move most on the gap between what happens and what investors expected. When reality beats depressed expectations, prices tend to rise to close that gap. Our research suggests the Iran conflict created exactly that dynamic for non-US developed markets. While the Iran war reset sentiment lower everywhere, it hit professional expectations for Europe and Asia particularly hard—harder than reality warrants. We think this makes the case for non-US leadership even more compelling than at 2026’s outset.
Tracking the Gap With the Guru Forecast
To identify these expectations-reality gaps, we monitor dozens of sentiment indicators. One we have used for over 30 years: our “Guru Forecast Compilation.” In Q4 of each year, we aggregate chief strategists’ year-end outlooks—covering equity index targets, interest rate expectations and more—and plot them to reveal where consensus opinion has clustered. This is essentially a top-down approach—the gurus actually make an index forecast.
That clustering matters, as markets pre-price commonly held views. The consensus, by definition, is therefore likely already in prices. So the Guru Forecast doesn’t tell us where markets are going—it tells us where they probably aren’t going.
More recently, we extended this framework to individual equity analysts. By aggregating price targets for each stock and weighting them by their share of index market capitalization, we can quantify a similar consensus signal with greater frequency and precision. Analysts typically update their targets far more often than strategists do, giving us closer to a real-time read on shifting sentiment. Because it is built from targets for index constituents, we call this the “Bottom-Up Guru Forecast Compilation.”
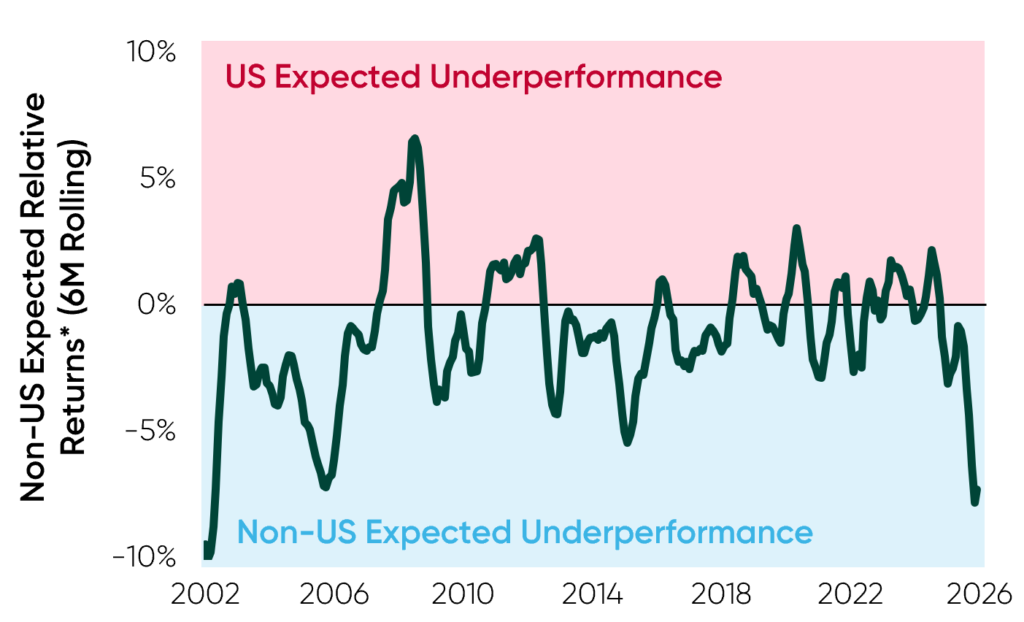
Today, the Bottom-Up Guru Forecast Compilation reveals the widest gap in expectations between US and non-US stocks—as measured by the MSCI EAFE Index—since 2002. That year marked the beginning of a five-year stretch of EAFE dominance over US stocks. Today’s gap is wider than at the start of 2025, when we first identified the non-US opportunity—despite a year of EAFE leadership already in the books. (Figure 1)
Figure 1: Non-US Stock Price Expected Returns Near 20-Year Lows Relative to US Counterparts
Corroborating the Signal
No single indicator tells all about sentiment, which is notoriously fickle. Accordingly, we never rely on any one gauge. The Guru Forecast, Top-Down or Bottom-Up, is one of dozens of sentiment measures we monitor globally. Other indicators are telling the same story.
Consider our aggregation of Wall Street chief economists’ GDP forecasts. Entering 2026, expected full-year GDP growth for the US exceeded the Eurozone’s by 0.9 ppt. Before the Iran conflict broke out, upgrades to US outlooks widened that gap to 1.3 ppt. During the conflict, economists cut their Eurozone growth forecasts more aggressively than US, pushing the gap to 1.5 ppt. Firms cited the war and the associated energy price spike, illustrating how sharply geopolitical fears swayed professional sentiment.
Dour Expectations Aren’t Enough on Their Own
Negative sentiment creates an opportunity only if reality is likely to prove better than feared. We think it is. Regional conflicts, even those involving major oil-producing areas, don’t typically derail bull markets. Investors tend to price in worst-case scenarios early. As uncertainty fades and the actual damage becomes clearer, sentiment recovers. We expect the Iran conflict’s fundamental economic effects to follow a similar pattern.
Figure 2: European Economic Indicators Are Anything but Dour
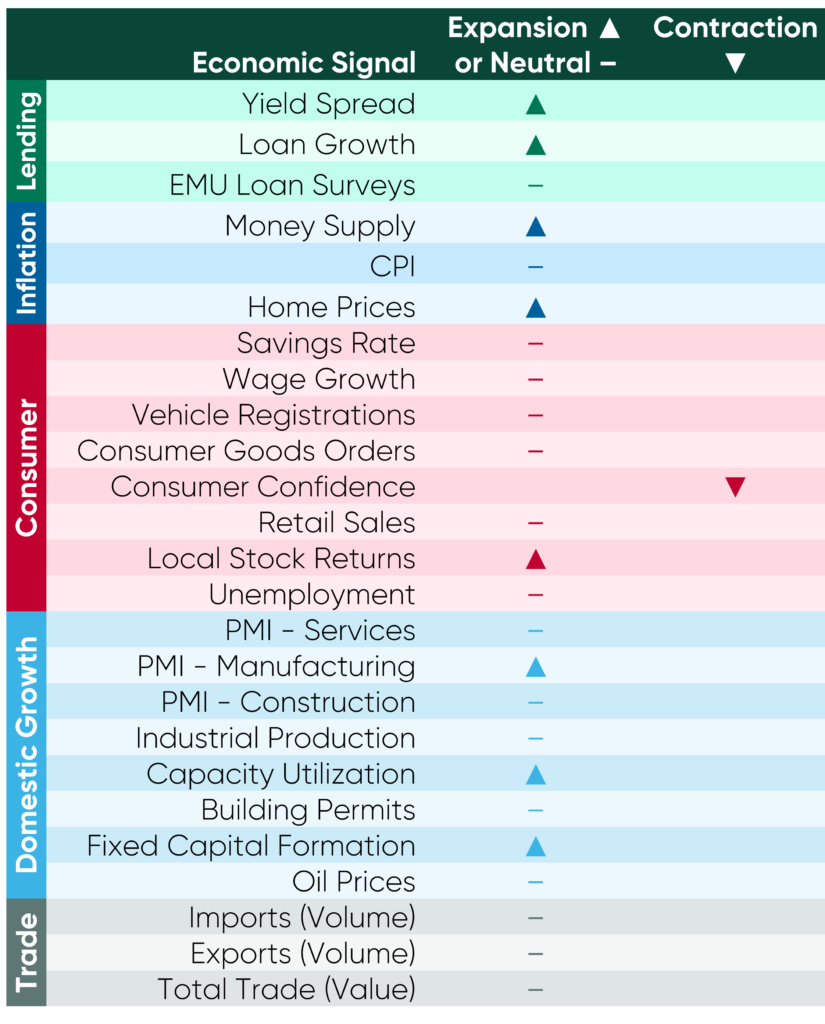
Figure 3: European Energy Cost Basket: Today vs 2022
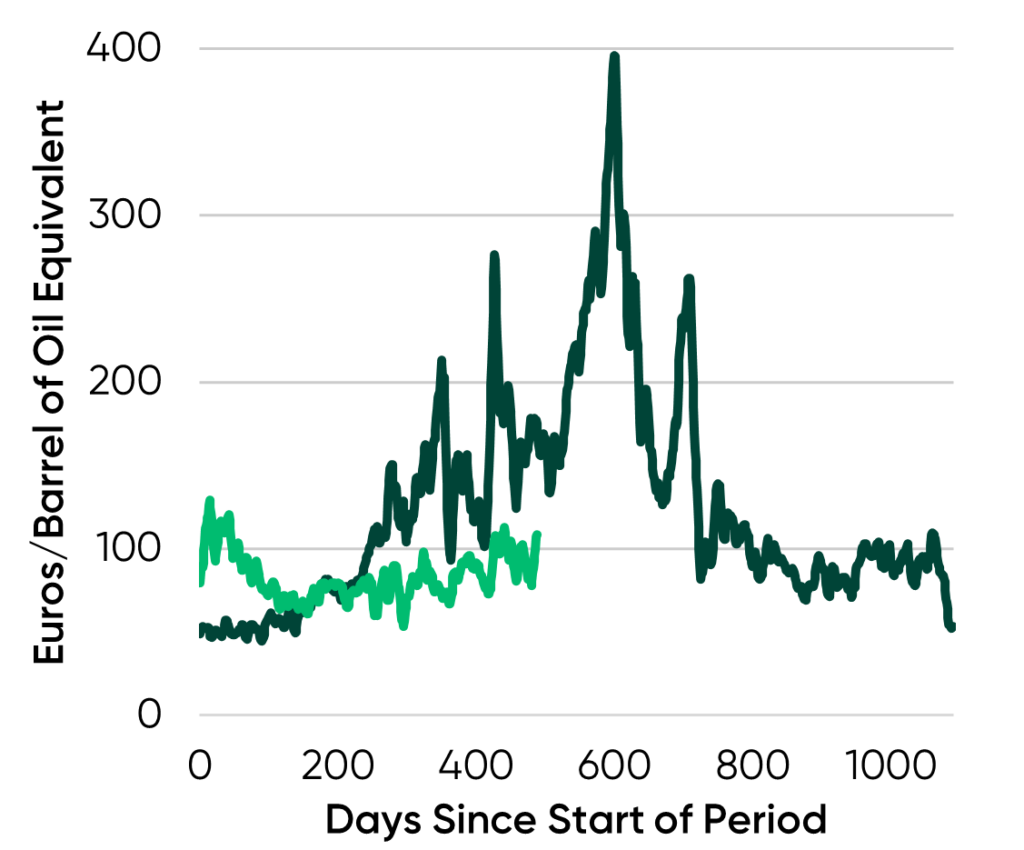
Crucially, money supply growth—inflation’s primary engine—is in line with prepandemic norms.i The 2022 crisis was also compounded by a lack of import infrastructure to replace Russian gas, a factor absent today.
In Asia, where dependence on Gulf oil is higher, the picture also looks better than feared. Japan holds roughly 200 days of oil reserves, providing a substantial buffer.ii Meanwhile, widely feared Japanese debt is actually getting cheaper, with interest payments’ share of tax revenue near 40-year lows.iii
The Bottom Line
The Iran conflict has done what geopolitical shocks often do: reset professional expectations lower, faster and further than economic data likely warrant. Across multiple indicators—Bottom-Up Guru, Wall Street GDP forecasts and others—the same message emerges: Non-US developed markets are more unloved today than they were when EAFE leadership began. History suggests that isn’t a reason for caution. It is a reason to stay the course.
To learn more about our views on global equity markets and access the latest market insights, visit the Fisher Investments Institutional Group website or contact us at institutional@fisherinvestments.com.
i Source: FactSet, as of 5/6/2026. Eurozone M3, UK M4 (excluding intermediate OFCs) and Japan M3, March 2026.
ii Source: “Japan plans to release extra 20 days’ oil reserves from May,” Katya Golubkova and Yuka Obayashi, Reuters, 4/10/2026.
iii Source: Japan Ministry of Finance, as of 5/6/2026. Interest Expenditure & Tax Revenues, 1985 – 2025.
Disclosures The foregoing information constitutes the general views of Fisher Investments and should not be regarded as personalized investment advice or a reflection of the performance of Fisher Investments or its clients. Investing in securities involves the risk of loss and there is no guarantee that all or any capital invested will be repaid. Past performance is never a guarantee nor reliable indicator of future results. Other methods may produce different results, and the results for individual portfolios or different periods may vary depending on market conditions and the composition of a portfolio or index. The value of investments and the income from them will fluctuate with world equity markets and international currency exchange rates. If you have asked us to comment on a particular security, then the information should not be considered a recommendation to purchase or sell the security for you or anyone else. We provide our general comments to you based on information we believe to be reliable. There can be no assurances that we will continue to hold this view; and we may change our views at any time based on new information, analysis or reconsideration. Some of the information we have produced for you may have been obtained from a third-party source that is not affiliated with Fisher Investments. Nothing herein is intended herein is intended to be a recommendation or a forecast of market conditions. Rather, it is intended to illustrate a point. Current and future markets may differ significantly from those illustrated herein. Not all past forecasts were, nor future forecasts may be, as accurate as those predicted herein.