


In client meetings I keep coming back to the chart below, which looks a little more vertical each time I study it.
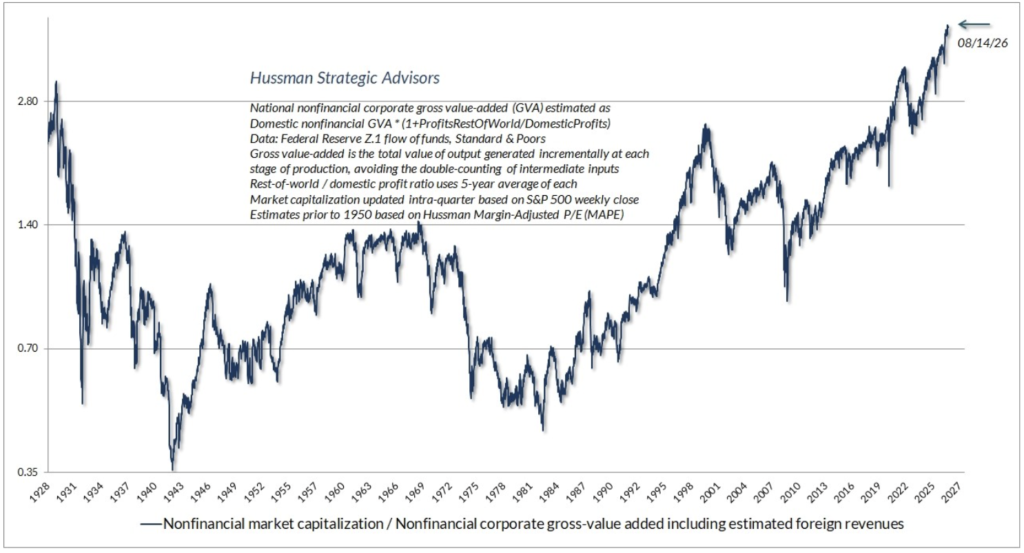
The chart tracks John Hussman’s ratio of U.S. non-financial market capitalization to gross value-added—his most reliable valuation gauge of data going back to 1928. As of August 14, 2026, it hit a new record high, surpassing the 2000 dot-com peak, the 1929 pre-crash peak, and the 2021 “everything bubble” peak all at once. Hussman himself, in his July 2026 commentary, noted the measure had already reached 4.2× at its recent extreme, against a century-long norm of about 1x.
| Indicator | Latest reading | Historical context |
| Hussman MarketCap / GVA | ≈ 3.4× (Aug 2026) | New all-time high; prior peaks 2.9× (2000), 3.1× (2021) |
| Buffett Indicator (Wilshire / GDP) | ≈ 237% (Sep 2026) | ~43% above long-term average |
| Shiller CAPE (10-yr real P/E) | ≈ 41× (Sep 2026) | 98th percentile since 1881; only 1929 and 2000 higher |
| FINRA margin debt | $1.417T (Jul 2026) | Peaked at $1.502T in Jun ’26, +77% in 14 months |
| Margin debt / GDP | ≈ 4.5% (Jun 2026) | Highest on record |
| Insider sell / buy ratio | 9.7 : 1 (Aug 2026) | 11 : 1 for 1H 2026; $77.6B sold, +20% YoY |
| % of firms with net insider buying | 14.8% (Jul 2026) | Lowest monthly reading in 21+ years |
Source: Hussman, J., “Mountain, Cliff, or Ocean,” Hussman Strategic Advisors, July 2026, hussmanfunds.com/comment/mc260715

I am not in the business of calling market tops. Nobody rings a bell. But part of my job—arguably the most important part—is to tell ultra-high-net-worth families when the risk they are being paid to take has quietly stopped being worth it. Right now, three independent bodies of evidence are flashing the same signal on U.S. equities: valuations are historically extreme, leverage in the system is at an all-time high, and the people who know their own companies best are selling into this strength at a pace not seen in a generation. Just as importantly, that story is largely a U.S. large-cap story, and I want to explore the pockets of the world where the setup looks more attractive.
U.S. valuations: three different lenses, one uncomfortable picture
The Hussman ratio is the headline item, but it does not stand alone. The Buffett Indicator—total U.S. equity market capitalization divided by GDP—sits at roughly 237 per cent as of September 2026, about 43 per cent above its long-term average and near an all-time high. The Shiller CAPE—the cyclically adjusted price-to-earnings ratio on the S&P 500—is around 41×, which places it in the 98th percentile of readings since 1881. Only 1929 and the 2000 dot-com peak were higher.
Three completely different construction methods arrive at the same conclusion: U.S. equities are priced for a future that does not have a lot of room for disappointment. As I told Wealth Professional earlier this year, the Hussman ratio at these levels historically implies negative 6 per cent annualized returns on the S&P 500 for the next 12 years. Not one year. Twelve. This does not mean the market falls tomorrow. It means the arithmetic of long-term returns has been pulled forward.
Leverage: a $1.5 trillion tell
The Financial Industry Regulatory Authority’s monthly margin-debt data provides one of the clearest windows we have into speculative behaviour, because it counts real dollars real investors have borrowed against real securities. In June 2026, outstanding margin debt hit an all-time high of $1.502 trillion, up 77 per cent in 14 months from roughly $850 billion in April 2025 (all amounts are in U.S. dollars). It cooled slightly to $1.417 trillion in July, but is still up 38.6 per cent year-over-year, and now sits at roughly 4.5 per cent of U.S. GDP—the highest reading on record, above the peaks of 2000, 2007 and 2021.
Every previous episode in which margin debt rose by more than 65 per cent inside a 15-month window was followed by a serious market decline:
- March 1999-March 2000: +80 per cent in margin debt, then the S&P 500 lost 49 per cent and the Nasdaq 78 per cent.
- June 2006-July 2007: +66 per cent, then the global financial crisis took the S&P 500 down 57 per cent.
- March 2020-October 2021: +95 per cent, then came a 25 per cent S&P / 33 per cent Nasdaq bear market in 2022.
- April 2025-June 2026: +77 per cent. History has not written the fourth line yet.
Insiders: the people who know are selling
If valuations show us where prices are, and margin debt shows us how the trade is financed, then insider activity shows us what the people running these companies actually think. Bloomberg data through the first half of 2026 shows U.S. corporate insiders sold a record $77.6 billion in stock, up 20 per cent year-over-year, at an 11-to-1 sell-to-buy ratio. Eight of the 10 largest individual sellers had direct ties to AI-linked companies. The month-by-month picture is worse, not better: the aggregated SEC Form 4 sell-to-buy dollar ratio was 9.7-to-1 in August 2026 and 7.7-to-1 in July, with insiders offloading roughly $20 billion of stock in August alone. Just 14.8 per cent of U.S. companies recorded more insider buying than selling in July 2026—the lowest monthly reading in at least 21 years, and among large-caps the number falls to a startling 3.2 per cent.
The other side of the ledger: where opportunity lives
Now—and this is the part I want clients to hear as clearly as the warnings—the paragraphs above describe a U.S. mega-cap problem. They do not describe the entire opportunity set. In fact, one of the more useful features of a lopsided market is that it tends to make the neglected corners genuinely cheap, and three of them stand out to me today.
- International equities. The MSCI EAFE Index (developed markets ex-U.S.) trades at roughly 16× forward earnings, versus about 22× for the S&P 500—near the widest relative discount in 15 years. The MSCI Emerging Markets Index is cheaper still, at roughly 11.5-12.5× forward earnings, a 44-50 per cent discount to the S&P 500—the widest gap in more than two decades. Currency, dividend yield and earnings-growth dispersion all add to the case for meaningful non-U.S. exposure inside multi-asset portfolios.
- Hard assets and commodities. Gold has broken decisively higher this cycle, with Goldman Sachs Research projecting central banks alone will absorb an average of 50 tonnes per month in 2026, roughly three times the pre-2022 pace. Copper is a related, but distinct, opportunity: the International Energy Agency now expects a structural supply deficit of up to 30 per cent by 2035 as electrification and grid build-out outrun mine supply. Uranium, silver, and select critical minerals share the same shape: constrained supply meeting a demand curve the market has been slow to price. These are not new stories—they are stories the market has been reluctant to fully believe, and that reluctance is exactly what has kept the entry prices attractive.
- Energy equities. The S&P 500 Energy sector trades at roughly 12.5× forward earnings while generating some of the highest free-cash-flow yields in the market—a valuation that reflects recession-level pessimism against a backdrop of disciplined capital spending and shareholder returns. Selectively, this is one of the few large-cap corners of the S&P where a serious cash-flow story is being handed to disciplined investors at a discount rather than at a premium.
The point is not to abandon U.S. equities—they remain the deepest, most innovative and most liquid market on the planet. The point is that the world outside U.S. mega-cap tech has quietly become far more interesting than the headlines suggest, and that a properly diversified portfolio in late 2026 looks very different from a market-cap-weighted global index.
A risk-management overlay: market hedges, both defensive and offensive
Alongside those constructive allocations, the Stenner Wealth Partners+ team is also deliberately deploying a set of protective and opportunistic market hedges—a formal risk-management overlay on top of the core portfolio. This is not a call to move to cash, and it is not a market-timing bet. It is an overlay designed to do two things at once.
- Defensive: cap the tail risk of a mean-reversion in the most expensive, most crowded parts of the U.S. market, so that a serious drawdown does not force selling of the assets we actually want to own.
- Offensive: convert a portion of that hedge into dry powder in the event of a real dislocation, so that we are buyers—not spectators—when quality assets are marked down.
The exact instruments differ by client mandate—index puts, structured collars, volatility-linked strategies, tactical short exposure inside certain alternatives sleeves, or defined-outcome vehicles—but the intent is consistent: convert some of today’s complacency premium into optionality. History rewards investors who show up with capital and calm during dislocations. That reserve of capital and calm has to be manufactured on purpose, before the dislocation begins.
What this means for portfolios
None of this tells us what happens next week. Valuation is a poor timing tool; markets can remain expensive for years. But it is a superb tool for setting expectations, and for calibrating how much of a family’s balance sheet should be exposed to a mean-reversion event that historically lasts over two years and takes more than five years to fully recover. For ultra-high-net-worth families, the question is not “will I miss the last 10 per cent of upside?” It is “can I absorb, without changing my life, the drawdown that has followed every prior setup like this, and am I positioned to take advantage of it when it happens?”
To achieve the latter this time around, I would consider:
- Rebalancing mercilessly. Trim U.S. large-cap equity concentration back to policy weight, tax-efficiently.
- Diversifying globally. Lean into the widest developed- and emerging-market valuation discounts in a generation.
- Owning real things. Add gold, copper, uranium and select energy exposure where structural supply/demand favours the owner.
- Deploying hedges with intent. Layer in a defensive/offensive overlay so a drawdown creates opportunity rather than damage.
- Rebuilding dry powder. Short-duration paper, T-bills, and select alternatives currently pay you to wait—a luxury we did not have in 2021.
- Stress-testing the plan, not the portfolio. Model a 40 per cent-plus U.S. equity drawdown lasting 24 months. If the family plan still works, keep the risk. If it does not, take some off—now, at these prices.
When I spoke with Wealth Professional earlier this year, I said U.S. equities were “in thin air.” Since then, the air has only gotten thinner. But thin air in one part of the map does not mean the whole map is unbreathable. The families who come out of the next cycle strongest will not be the ones who squeezed the last percent out of the S&P 500. They will be the ones who diversified beyond it, owned some hard assets while the world was still under-owning them, hedged the tail with intent, and had capital to deploy when the tape finally turned.
Follow Thane Stenner and Stenner Wealth Partners+ on LinkedIn.
Thane Stenner Interviews/Articles, Member of Canadian Family Offices.
About Stenner Wealth Partners+
Stenner Wealth Partners+ (SWP+) is an in person/virtual Multi-Family Office/Outsourced CIO Consulting team of financial/wealth specialists with a boutique approach and global perspective. SWP+ serves Canadian and US investors/households with generally a minimum of 10M+ in investable assets (or 25M+ net worth). As a CG Wealth Management team, SWP+ is a highly exclusive practice team with one of Canada’s largest independent wealth management firms. Client Range of Net Worths: between $25M To $3B+. They strategically limit new client engagements, onboarding a select number of new key relationships annually to ensure a highly personalized and focused approach. SWP+ is a member of Canadian Family Offices.
Disclaimer: This story was created by Canadian Family Offices’ commercial content division on behalf of Stenner Wealth Partners+ at CG Wealth Management, which is a member and content provider of this publication. CG Wealth Management is a division of Canaccord Genuity Corp., member of CIPF and CIRO. Tax & Estate advice offered through Canaccord Genuity Wealth & Estate Planning Services Ltd. Thane Stenner’s views, including any recommendations, expressed in this article are his own only, and are not necessarily those of Canaccord Genuity Corp.